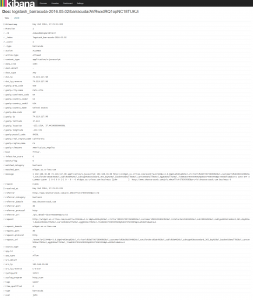
I use a Barracuda Web Filter 410 vX. While looking around on the web I couldn’t find any filters that did exactly what I wanted so I created some. The filters will parse both logs from the web interface as well as the access log. Here is an example of the fields that are grok’ed from the access log that show in Kibana (click to enlarge):
The filter is split up into two files:
- 05-syslog-parse_barracuda.conf – This will do the initial parsing of the syslog entry. You will need to edit this and enter the correct IP address of your web filter.
- 20-barracuda.conf – This will parse the access logs and pull out the interesting fields.
